

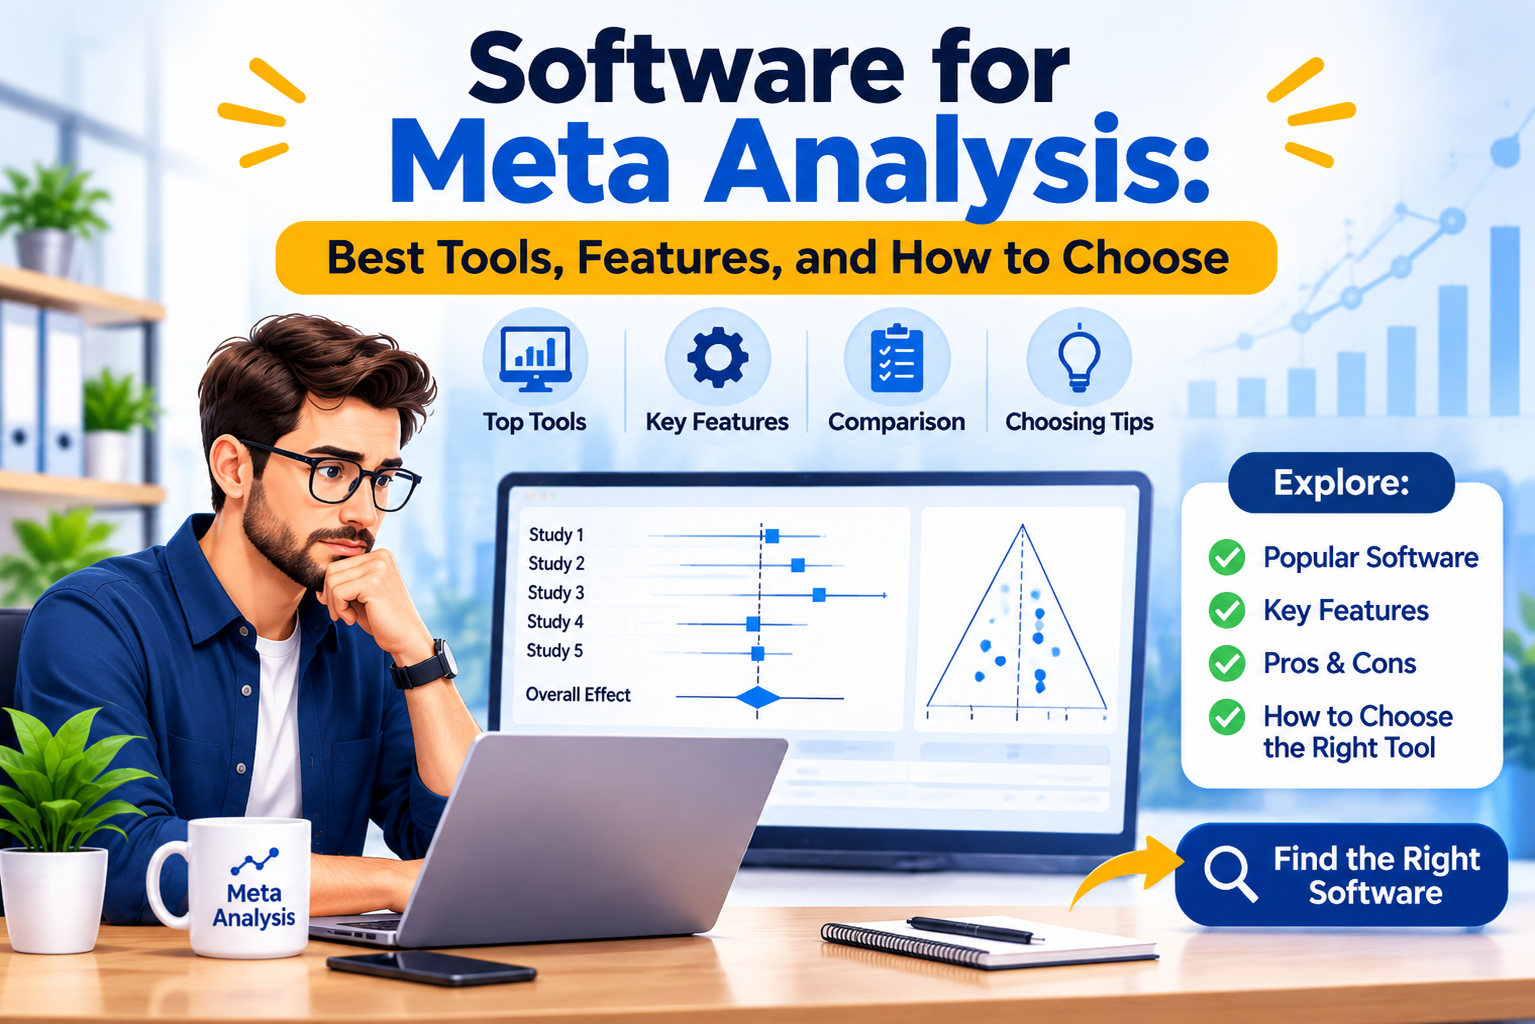
Meta-analysis brings together results from multiple independent studies to identify patterns, estimate overall effects, and draw stronger conclusions from existing research. However, combining research findings requires more than a spreadsheet. Researchers need tools that can calculate effect sizes, assess heterogeneity, create forest plots, and evaluate publication bias accurately.
Choosing the right software for meta analysis depends on your research design, statistical experience, budget, and reporting requirements. Some tools offer straightforward interfaces for beginners, while others provide advanced statistical models and greater flexibility. This guide compares popular options, including RevMan, R, and other dedicated applications. It also explains what features to look for and how to select a suitable tool for your research project.
What Is Software for Meta Analysis?
Software for meta-analysis is a statistical application used to combine and analyze quantitative findings from multiple research studies. It helps researchers calculate pooled effect estimates, examine differences between studies, evaluate statistical uncertainty, and present results through visualizations such as forest and funnel plots.
These tools are commonly used in:
Medical and clinical research
Public health and epidemiology
Psychology and behavioral science
Education and social sciences
Evidence-based policy research
Systematic reviews and academic research
For example, a researcher investigating whether a particular treatment improves patient outcomes may collect results from several clinical trials. Meta-analysis software can combine the findings and estimate the overall treatment effect while accounting for differences between studies.
Best Software for Meta Analysis: 7 Popular Options
The best software depends on the type of data, statistical methods, and level of control required. Some applications are designed for systematic reviews, while others support broader statistical analysis.
Here are seven widely used options.
1. RevMan (Review Manager)
Best for: Systematic reviews and evidence synthesis
RevMan is a well-known tool developed by Cochrane to support the preparation and analysis of systematic reviews. It provides a structured environment for organizing review information and conducting statistical analyses.
Its features include:
Data organization for systematic reviews
Forest plot generation
Common meta-analysis calculations
Support for different outcome types
Review preparation and reporting workflows
RevMan software for meta-analysis free download is a common search among students and researchers looking for an accessible tool. However, users should visit the official Cochrane website to check current access arrangements, supported features, and download options.
The Meta-analysis software RevMan is particularly useful for researchers working with clinical evidence and systematic review methods. Its structured interface can also make it easier for beginners to understand standard review workflows.
2. R and RStudio
Best for: Advanced statistical analysis and customization
R is a programming language and statistical computing environment with a large collection of packages for meta-analysis. RStudio, now commonly known as Posit RStudio, provides an integrated development environment for working with R.
Popular R packages include:
metafor: Supports a broad range of meta-analysis models and statistical methods.
meta: Provides functions for common meta-analysis procedures and visualizations.
dmetar: Offers additional tools and resources for meta-analysis workflows.
Researchers often choose R software for meta analysis because it provides flexibility and control over statistical procedures.
R can be particularly useful when a project requires:
Random-effects and fixed-effect models
Subgroup analysis
Meta-regression
Sensitivity analysis
Customized forest plots
Reproducible statistical workflows
R is free and open source. However, users need to become familiar with its syntax and packages. Beginners may need time to learn how to import data, select statistical models, and interpret the output correctly.
3. Comprehensive Meta-Analysis (CMA)
Best for: Researchers who prefer a dedicated graphical interface
Comprehensive Meta-Analysis is a specialized application designed for statistical synthesis of research findings.
It supports common meta-analysis procedures and provides tools for examining results through tables and visualizations.
Its capabilities include:
Effect size calculations
Fixed-effect and random-effects models
Forest plots
Funnel plots
Subgroup analysis
Meta-regression
CMA is worth considering for researchers who want dedicated meta-analysis functionality without relying entirely on programming. It is commercial software, so users should review licensing and pricing before selecting it.
4. JASP
Best for: Beginners and researchers who prefer a graphical interface
JASP is an open-source statistical application with a graphical interface. It supports several statistical procedures, including meta-analysis through its available modules and features.
Its advantages include:
Menu-based analysis
Clear statistical output
Visual reporting
Accessible workflows for many common procedures
Integration with broader statistical analysis tasks
JASP can be a useful starting point for students and researchers who want to perform statistical analysis without writing code. Before starting a project, check whether its current meta-analysis functionality supports the effect measures and models required by your research question.
5. OpenMeta[Analyst]
Best for: Researchers seeking an accessible meta-analysis interface
OpenMeta[Analyst] is an open-source tool developed to support evidence synthesis and meta-analysis. It provides a graphical environment for conducting common analyses.
Researchers may use it for:
Combining study results
Calculating pooled estimates
Creating forest plots
Exploring heterogeneity
Performing selected subgroup analyses
Its accessibility makes it worth considering for academic projects. However, users should verify its current maintenance status, compatibility, and available methods before depending on it for a new project.
6. Stata
Best for: Statistical researchers and advanced workflows
Stata is a general statistical software package with dedicated commands for meta-analysis. It is widely used in research settings where statistical analysis, data management, and reporting need to be handled within one environment.
Its meta-analysis capabilities can support:
Effect size estimation
Fixed-effect and random-effects models
Heterogeneity assessment
Forest and funnel plots
Meta-regression
Sensitivity analysis
Stata is a commercial application. It may be appropriate for researchers who already use it for other statistical tasks and want to manage meta-analysis within the same environment.
7. Excel and Spreadsheet-Based Tools
Best for: Organizing data and preliminary calculations
Microsoft Excel and similar spreadsheet applications can help researchers organize extracted study data, check calculations, and prepare datasets for statistical analysis.
However, spreadsheets are not a complete replacement for dedicated meta-analysis software.
They may be useful for:
Recording study characteristics
Organizing sample sizes and outcome data
Checking extracted information
Preparing datasets for other applications
For complex statistical procedures, a dedicated program for meta analysis is generally more suitable. Manual calculations can introduce errors, especially when handling different effect measures, study weights, and statistical models.
Comparison of Popular Meta-Analysis Tools
The following table provides a practical overview of the available options.
Software | Cost model | Main strength | Technical level |
RevMan | Check current access options | Systematic review workflows | Beginner to intermediate |
R | Free and open source | Advanced statistical flexibility | Intermediate to advanced |
Comprehensive Meta-Analysis | Commercial | Dedicated analysis interface | Beginner to advanced |
JASP | Free and open source | Graphical statistical analysis | Beginner to intermediate |
OpenMeta[Analyst] | Open-source project | Accessible meta-analysis tools | Beginner to intermediate |
Stata | Commercial | Statistical analysis and meta-analysis | Intermediate to advanced |
Excel | Commercial or subscription-based | Data organization | Beginner |
No single option is best for every project. Researchers should compare supported methods, documentation, compatibility, and reporting requirements before making a decision.
Free Software for Meta Analysis: What Are Your Options?
Researchers often look for software for meta analysis free because academic budgets, student projects, and independent research may not support expensive licenses.
Several options offer free access or open-source functionality.
R and Its Meta-Analysis Packages
R is one of the strongest free options for researchers who need advanced statistical methods. Packages such as metafor and meta provide tools for calculating effect sizes, fitting statistical models, and producing visualizations.
Its main limitation is the learning curve associated with programming.
JASP
JASP provides a free graphical interface that can make statistical analysis more accessible. It is worth exploring if you prefer selecting analysis options through menus rather than writing code.
Open-Source Projects
Researchers can also investigate open-source applications and packages designed for evidence synthesis.
When searching for Meta-analysis software free download, avoid unofficial download websites. Use the developer's official website or trusted software repositories to reduce the risk of downloading outdated or modified files.
A Meta-analysis tool should be evaluated based on its statistical capabilities, not simply whether it is free.
How to Choose the Best Software for Meta Analysis
Selecting the right application requires understanding what your research project actually needs.
Consider these factors before making a decision:
1. Identify Your Research Design
Start by identifying the type of research and outcome data you will analyze.
For example:
Continuous outcomes may require mean differences or standardized mean differences.
Binary outcomes may require risk ratios or odds ratios.
Diagnostic accuracy reviews may need specialized statistical methods.
Time-to-event outcomes may require hazard ratios.
Choose software that supports the effect measures relevant to your project.
2. Check Statistical Features
A suitable application should support the procedures required by your research protocol.
Look for:
Fixed-effect and random-effects models
Heterogeneity statistics
Subgroup analysis
Sensitivity analysis
Meta-regression
Forest plots
Publication bias assessment
Not every application supports all these features. Check the documentation before committing to a particular tool.
3. Consider Your Technical Skills
Your statistical experience should influence your choice.
If you are new to meta-analysis, a graphical application such as RevMan or JASP may be easier to approach.
If you have programming experience and need advanced customization, R may provide more flexibility.
4. Evaluate Reporting and Reproducibility
A research analysis should be transparent and reproducible.
Choose a tool that allows you to preserve:
Original study data
Effect size calculations
Model specifications
Analysis settings
Statistical outputs
Documentation of changes
R scripts can be particularly useful because they record the analysis steps. Other applications may provide project files or export options that support documentation.
5. Review Cost and Support
Compare licensing fees, free access, technical documentation, tutorials, and community support.
A free application may be sufficient for a student project, while a research institution may already provide access to commercial software.
How to Perform a Meta-Analysis Using Software
Although individual applications have different interfaces, most meta-analysis projects follow a similar process.
Step 1: Define the research question
Create a focused research question and establish the inclusion and exclusion criteria for selecting studies.
Step 2: Conduct a systematic literature search
Search relevant academic databases and record how studies were identified and selected.
Step 3: Extract study data
Collect the information required for analysis, such as sample sizes, outcome measurements, effect estimates, and standard errors.
Step 4: Select the appropriate effect measure
Choose an effect measure that matches the research question and the type of data.
Step 5: Select a statistical model
Decide whether a fixed-effect or random-effects model is appropriate. This decision should be based on the research question, assumptions, and expected variation between studies.
Step 6: Assess heterogeneity
Examine how much study results differ. Statistical measures such as Cochran's Q and I² can help describe heterogeneity, but they should be interpreted alongside clinical and methodological differences.
Step 7: Generate and interpret results
Create forest plots and review pooled estimates, confidence intervals, and other relevant outputs.
Step 8: Report the methods transparently
Document the software version, packages or modules, statistical methods, assumptions, and analysis decisions.
The software performs calculations, but researchers remain responsible for selecting suitable methods and interpreting the findings.
Common Mistakes to Avoid
Even the best application cannot correct weaknesses in research design or data extraction.
Avoid these common problems:
Choosing software before defining the research question: Select tools based on the methods your project requires.
Combining incompatible studies: Statistical pooling should be justified by meaningful similarities in research questions, populations, interventions, and outcomes.
Ignoring heterogeneity: Investigate differences between studies rather than relying only on the pooled estimate.
Misinterpreting publication bias tests: Funnel plots and statistical tests have limitations, particularly when few studies are available.
Using incorrect effect measures: Ensure the selected measure matches the study design and outcome.
Failing to document analysis decisions: Keep a clear record of data extraction, model selection, and software settings.
A reliable meta-analysis depends on sound methodology as much as accurate calculations.
6. FAQs
1. What is the best software for meta analysis?
The best option depends on your research needs. RevMan is useful for systematic review workflows, R provides advanced statistical flexibility, and Comprehensive Meta-Analysis offers a dedicated graphical interface. JASP is another option for researchers who prefer menu-based analysis.
2. Is there any free software for meta-analysis?
Yes. R and JASP are free and open-source options. Researchers can also investigate OpenMeta[Analyst]. RevMan access arrangements and available features should be checked through Cochrane's official resources.
3. Is RevMan software free to download?
RevMan has offered access options for systematic review work, but availability and licensing arrangements can change. Check the official Cochrane website for the current version, eligibility requirements, and download instructions.
4. Is R suitable for meta-analysis?
Yes. R supports meta-analysis through packages such as metafor and meta. It can perform fixed-effect and random-effects analyses, subgroup analysis, meta-regression, and visualization. Some programming knowledge is helpful.
5. What is the difference between RevMan and R?
RevMan provides a structured environment for systematic review workflows, while R is a flexible statistical programming environment. R offers greater customization and access to a wider range of statistical packages, but it generally requires more technical knowledge.
6. Can beginners perform meta-analysis?
Yes. Beginners can use graphical applications such as RevMan or JASP to learn common procedures. However, understanding effect sizes, heterogeneity, study selection, and statistical assumptions is essential regardless of the software.
7. Can Excel be used for meta-analysis?
Excel can organize extracted data and support preliminary calculations. However, it is generally less suitable than dedicated statistical applications for complex models, heterogeneity assessment, and reproducible analysis.
Conclusion
Choosing the right software for meta analysis can make research workflows more organized, transparent, and efficient. RevMan is a practical option for systematic review workflows, R offers extensive statistical flexibility, and applications such as JASP, Stata, and Comprehensive Meta-Analysis serve different research needs.
Before selecting a tool, consider your research design, required statistical methods, technical experience, and budget. Most importantly, remember that software does not determine whether a meta-analysis is scientifically sound. Reliable results depend on appropriate study selection, accurate data extraction, suitable statistical methods, and careful interpretation.
Have a question or a different perspective? Share it below.